NetworkTests Monitor — Continuous Monitoring That Names the Culprit
Free network monitoring for Windows, Mac and Linux. Continuously monitor packet loss, Wi-Fi, latency, applications and bufferbloat, identify where problems start, and export PDF evidence reports.
A speed test tells you what your connection looks like for the thirty seconds you're watching. The problems that actually ruin your week happen when you aren't watching: the video call that breaks up every evening, the game that lags for ninety seconds at a time, the connection that was "fine this morning" but becomes unusable every night. And when it happens, there's usually no evidence left behind.
We built the connection test on networktests.com for the first kind of problem: something is wrong right now — measure it. Today we're releasing NetworkTests Monitor for the second kind: a free desktop app for macOS, Windows and Linux that measures your connection every second, keeps the history on your machine, and — the part we care most about — helps tell you where the problem starts.
Download NetworkTests Monitor
Free for personal use. No account. No sign-up. Your monitoring history stays on your computer.
Monitor is built for anyone who needs to understand intermittent internet problems — remote workers whose calls keep dropping, gamers chasing lag spikes, home users tired of "everything looks fine from our side," and IT professionals who need evidence instead of anecdotes.
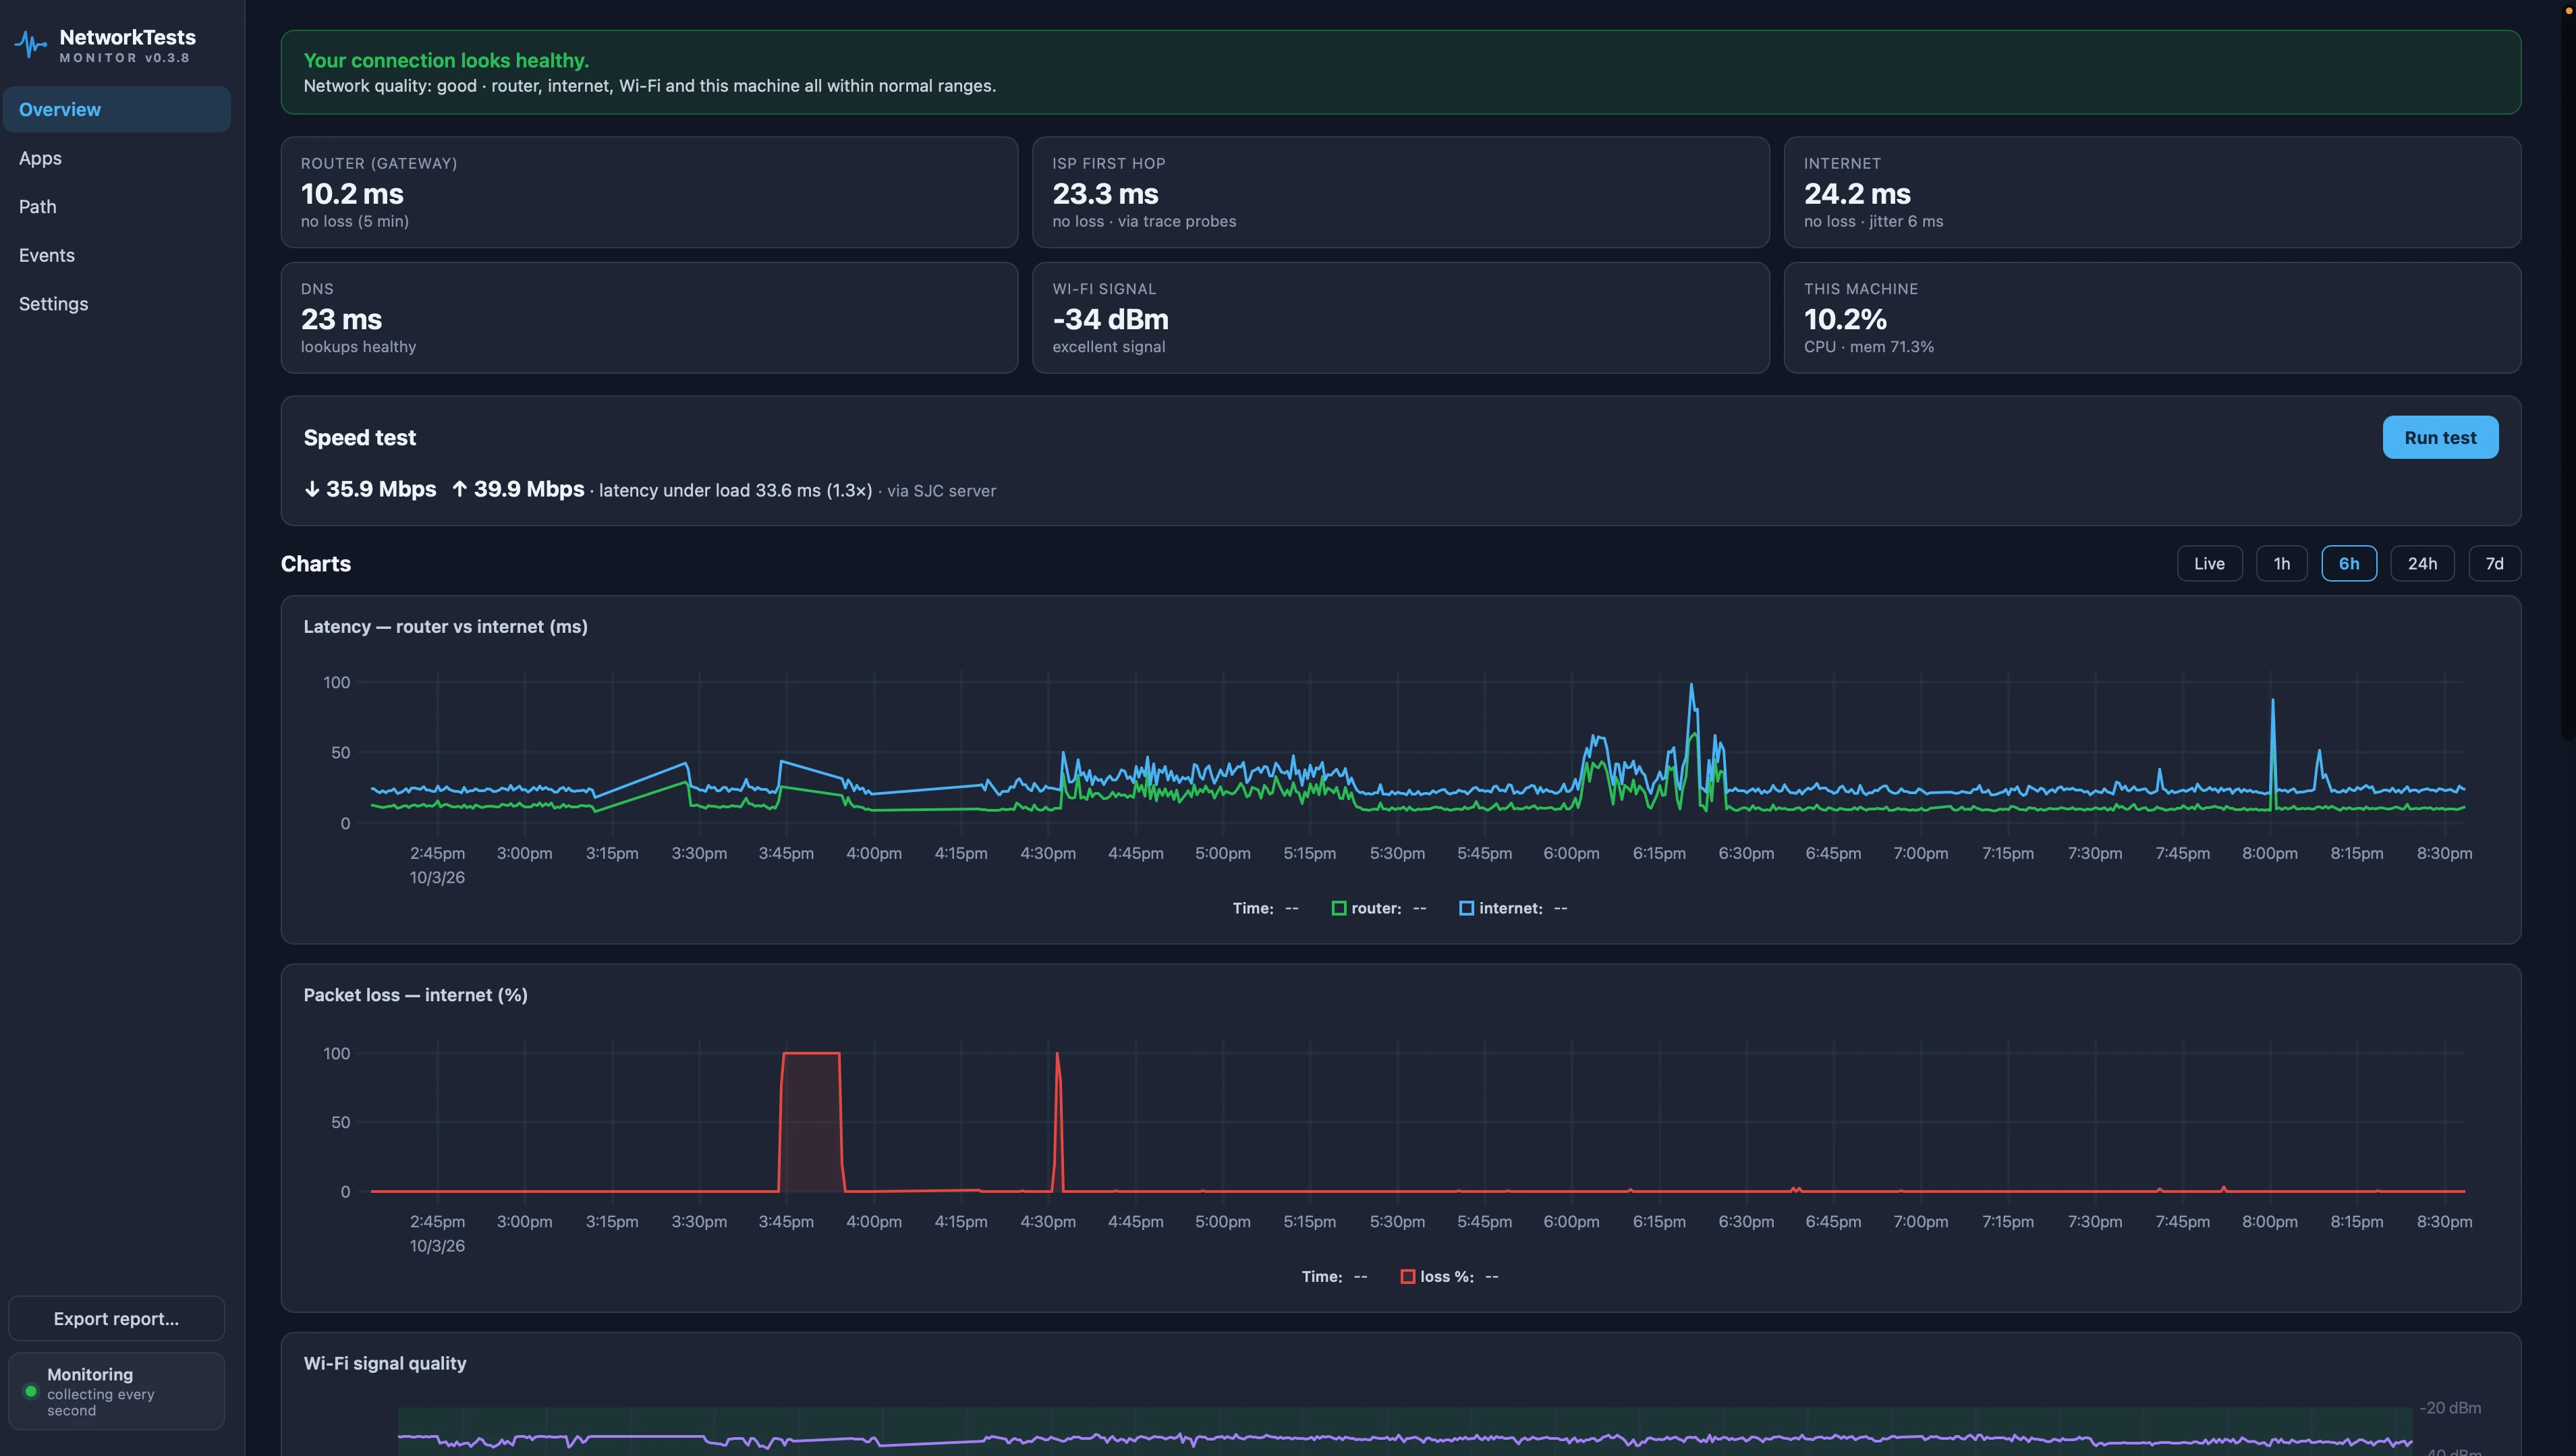
The question that matters isn't "how fast" — it's "where's the problem?"
When a connection misbehaves, there are several places to investigate: the Wi-Fi link between you and your router, the router itself, the path beyond your home network, your computer, or the application you're trying to use. Every useful troubleshooting session is really an elimination exercise across those possibilities — and almost every tool makes you do the eliminating.
Monitor does the elimination continuously. Every second, it probes multiple points independently:
- Your router — the default gateway and first local network hop.
- Your ISP's first hop — the first hop that answers beyond your home network (on most connections, your ISP's equipment), discovered automatically through path tracing and monitored directly when it responds to probes. Consistent trouble here while the router stays healthy is strong evidence the problem begins beyond your home network.
- The internet — five independent anchors: Google's 8.8.8.8 and 8.8.4.4, Cloudflare's 1.1.1.1 and 1.0.0.1, and Quad9's 9.9.9.9.
Alongside those measurements, Monitor tracks Wi-Fi signal strength, DNS response times, CPU and memory usage, and — if you add them — the applications you actually depend on.
The output isn't a wall of graphs, although the graphs are there. It's a sentence — these are the app's own words:
Your home network is healthy, but your ISP is experiencing congestion. home network clean (0.0% loss), internet path losing 6.4%
Or:
Your computer is under heavy CPU/memory pressure and network performance is degraded. CPU peaked 100%, memory 71%, and every probe path degraded together
That second one matters more than it looks. A computer under heavy CPU or memory pressure can affect networking all by itself, and measurements taken while the machine is overloaded can be misleading. That's why Monitor correlates system pressure with network measurements instead of automatically blaming the ISP whenever something goes wrong.
Packet loss that one server can't fake
A subtle but important design choice: internet packet loss is packet-weighted across all five anchors.
Public DNS services can rate-limit or deprioritize ICMP probes, and a single anycast node can sometimes make it look like your connection is losing packets when the problem is actually isolated to that destination. With five independent anchors across three providers, a single service behaving badly has much less influence on the overall picture. Loss that appears consistently across multiple independent destinations is much stronger evidence of a problem affecting your connection or its upstream path.
The same principle applies to the router. VPN clients and restrictive networks can prevent gateway probes from receiving replies — corporate laptops can be particularly difficult to probe reliably. Monitor detects that situation and reports it as information rather than turning a missing reply into a false outage:
Your router doesn't answer test probes — internet monitoring is unaffected.
If a VPN changes the default route, Monitor evaluates the available candidates and looks for a gateway that actually answers. The goal isn't to manufacture a diagnosis — it's to give you better evidence.
Monitor the apps you actually care about
"The internet is fine but Teams is unusable" is its own category of misery, and ping alone can't explain it.
Monitor's Apps page adds application-level checks: one click for Zoom, Microsoft Teams, Slack, Microsoft 365, Salesforce, Google Meet or GitHub — or any host you name. Choose HTTPS, a raw TCP port, or plain ping; Monitor supports up to 30 applications or destinations.
For web applications, every check is broken into its major phases:
DNS lookup → TCP connect → TLS handshake → server wait → data transfer
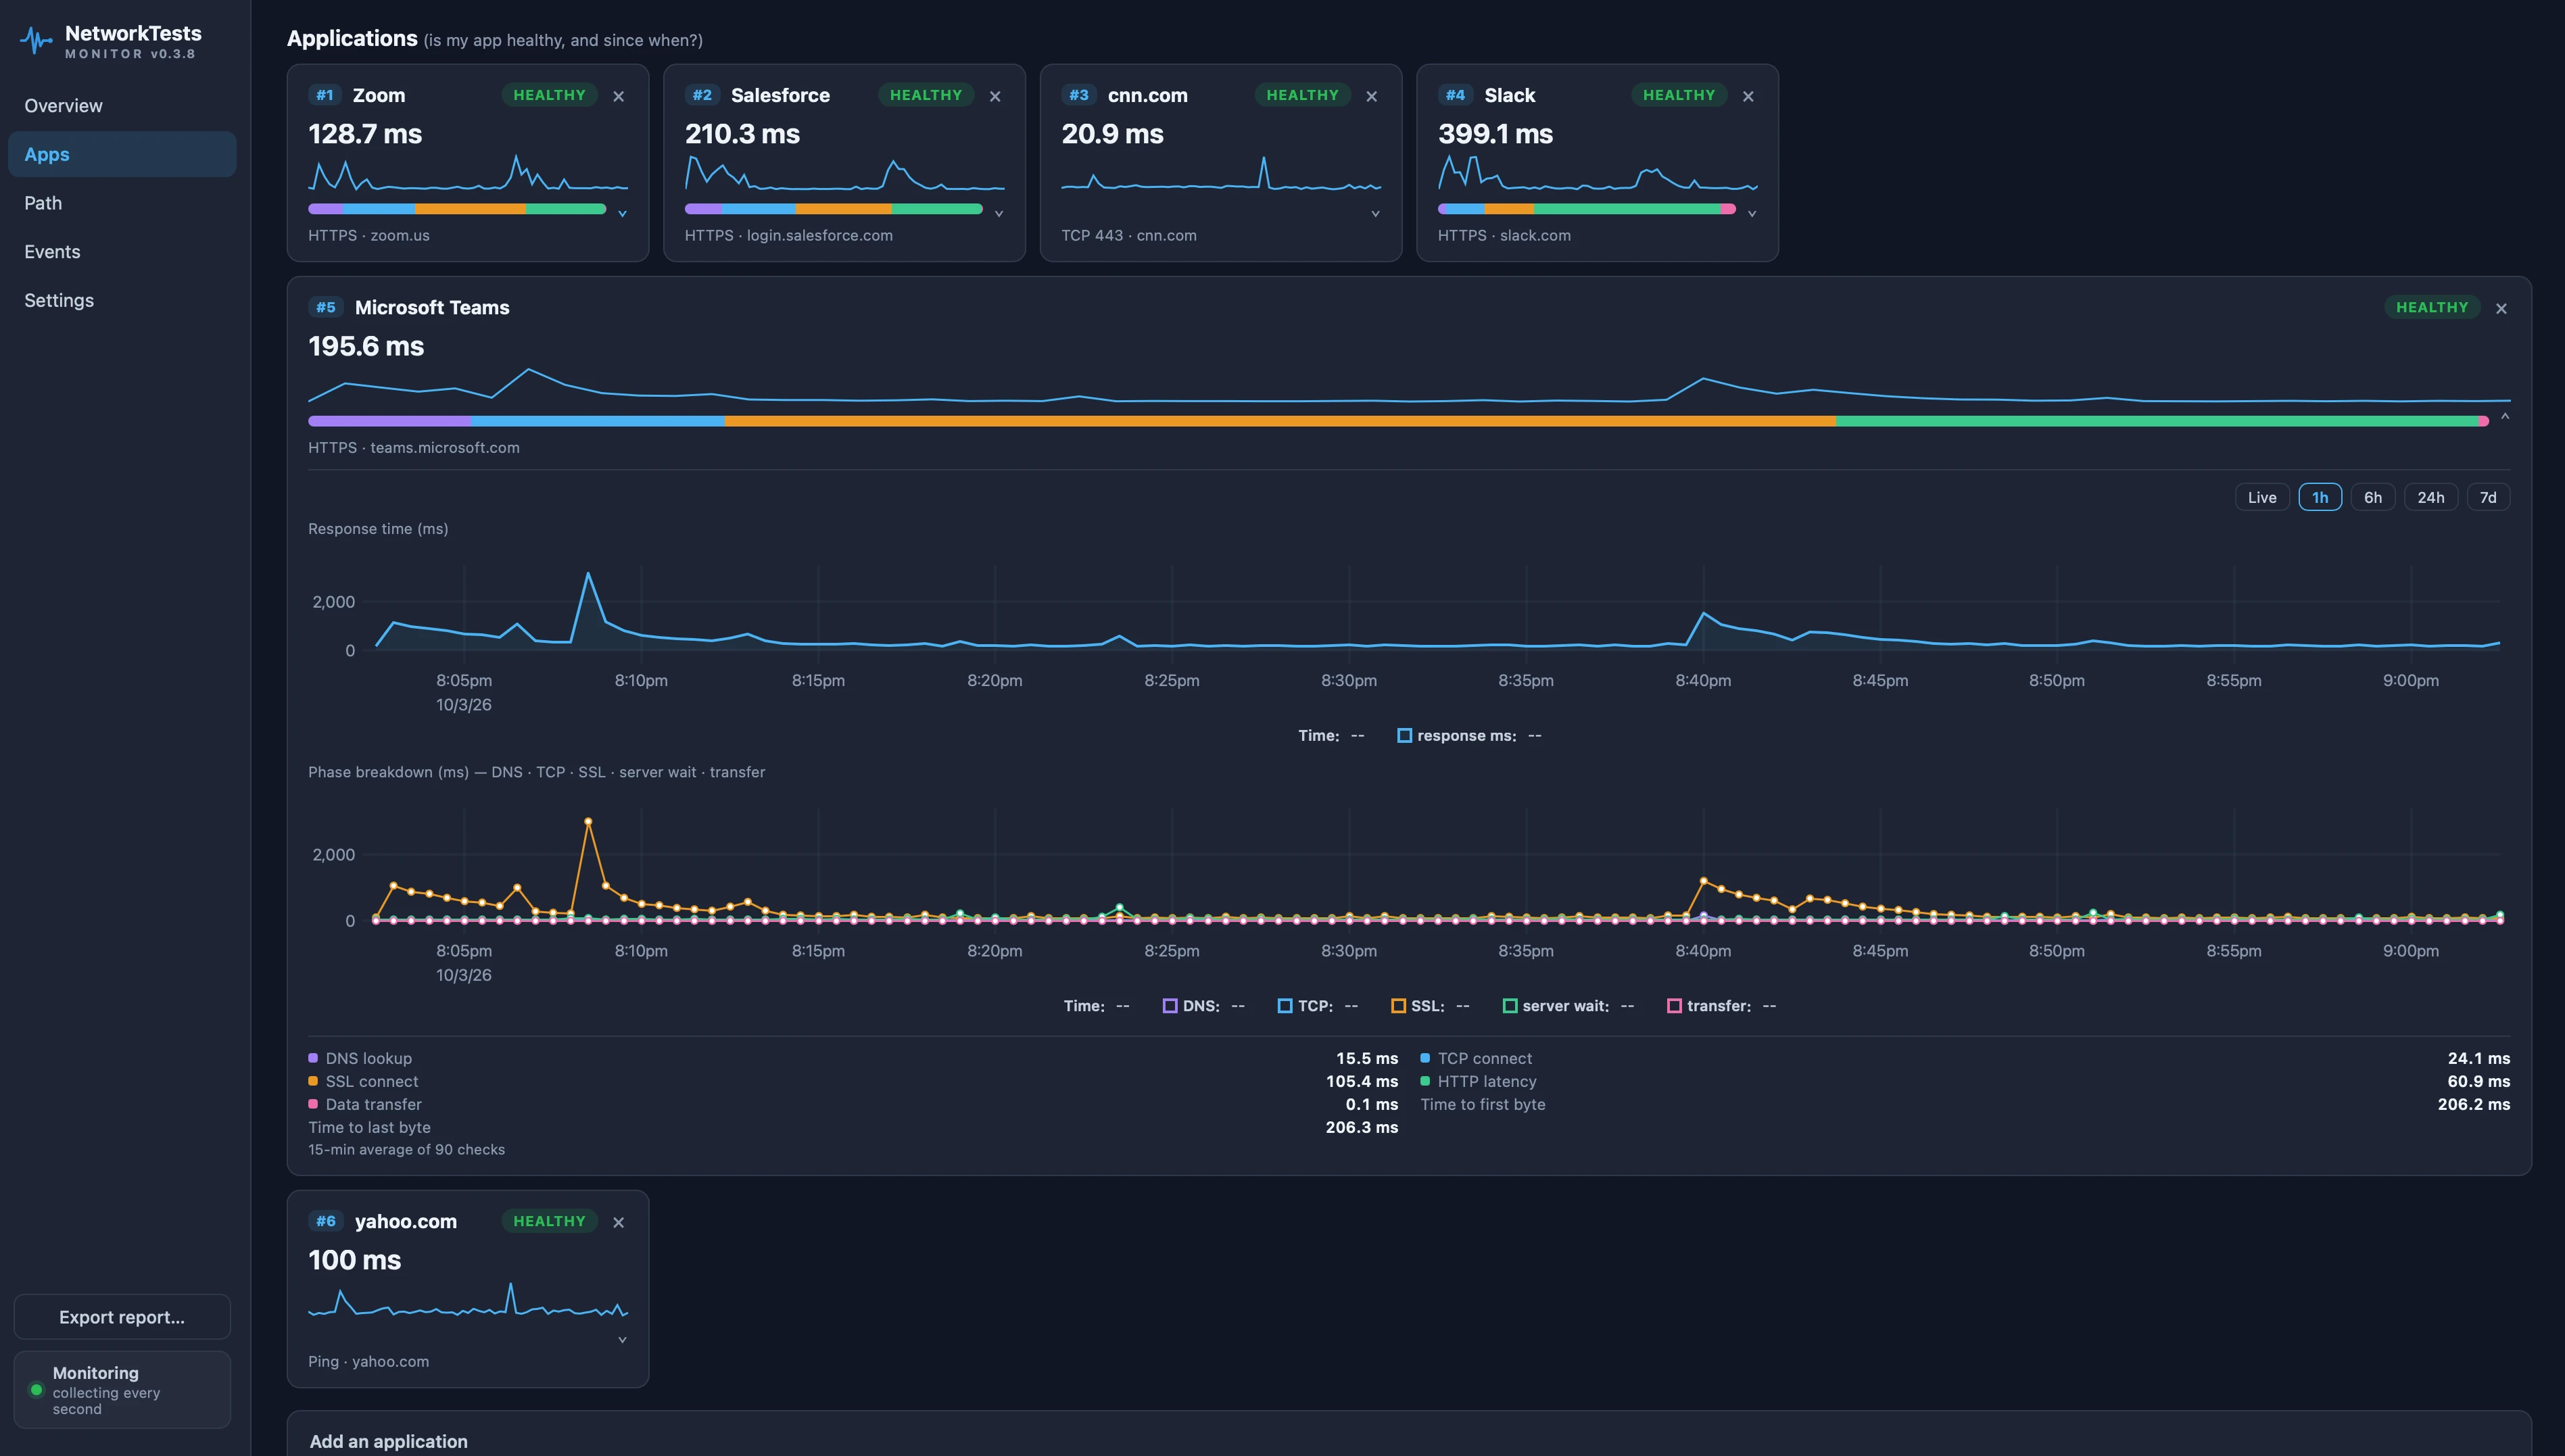
You get the same kind of timing breakdown a network engineer would want during troubleshooting, presented as a time series you can watch over hours or days. When Salesforce becomes slow, the phase breakdown answers a much more useful question than "is Salesforce slow?" — is the delay in DNS? In TCP or TLS connection setup? Or is the connection established quickly, with most of the delay occurring while waiting for the remote service to respond?
Two details here make Monitor particularly useful.
Baselines are learned, not configured
Monitor learns each application's normal response time from the previous 24 hours and flags significant deviations from that baseline — in practice, responses taking more than twice the learned normal and at least 100 ms longer, sustained for about a minute, so a single slow response doesn't count. Nobody has to decide that, for example, 300 ms is universally "slow" for Teams from your house. The baseline is specific to your connection.
Notifications are aggregated, because one slow app isn't your network
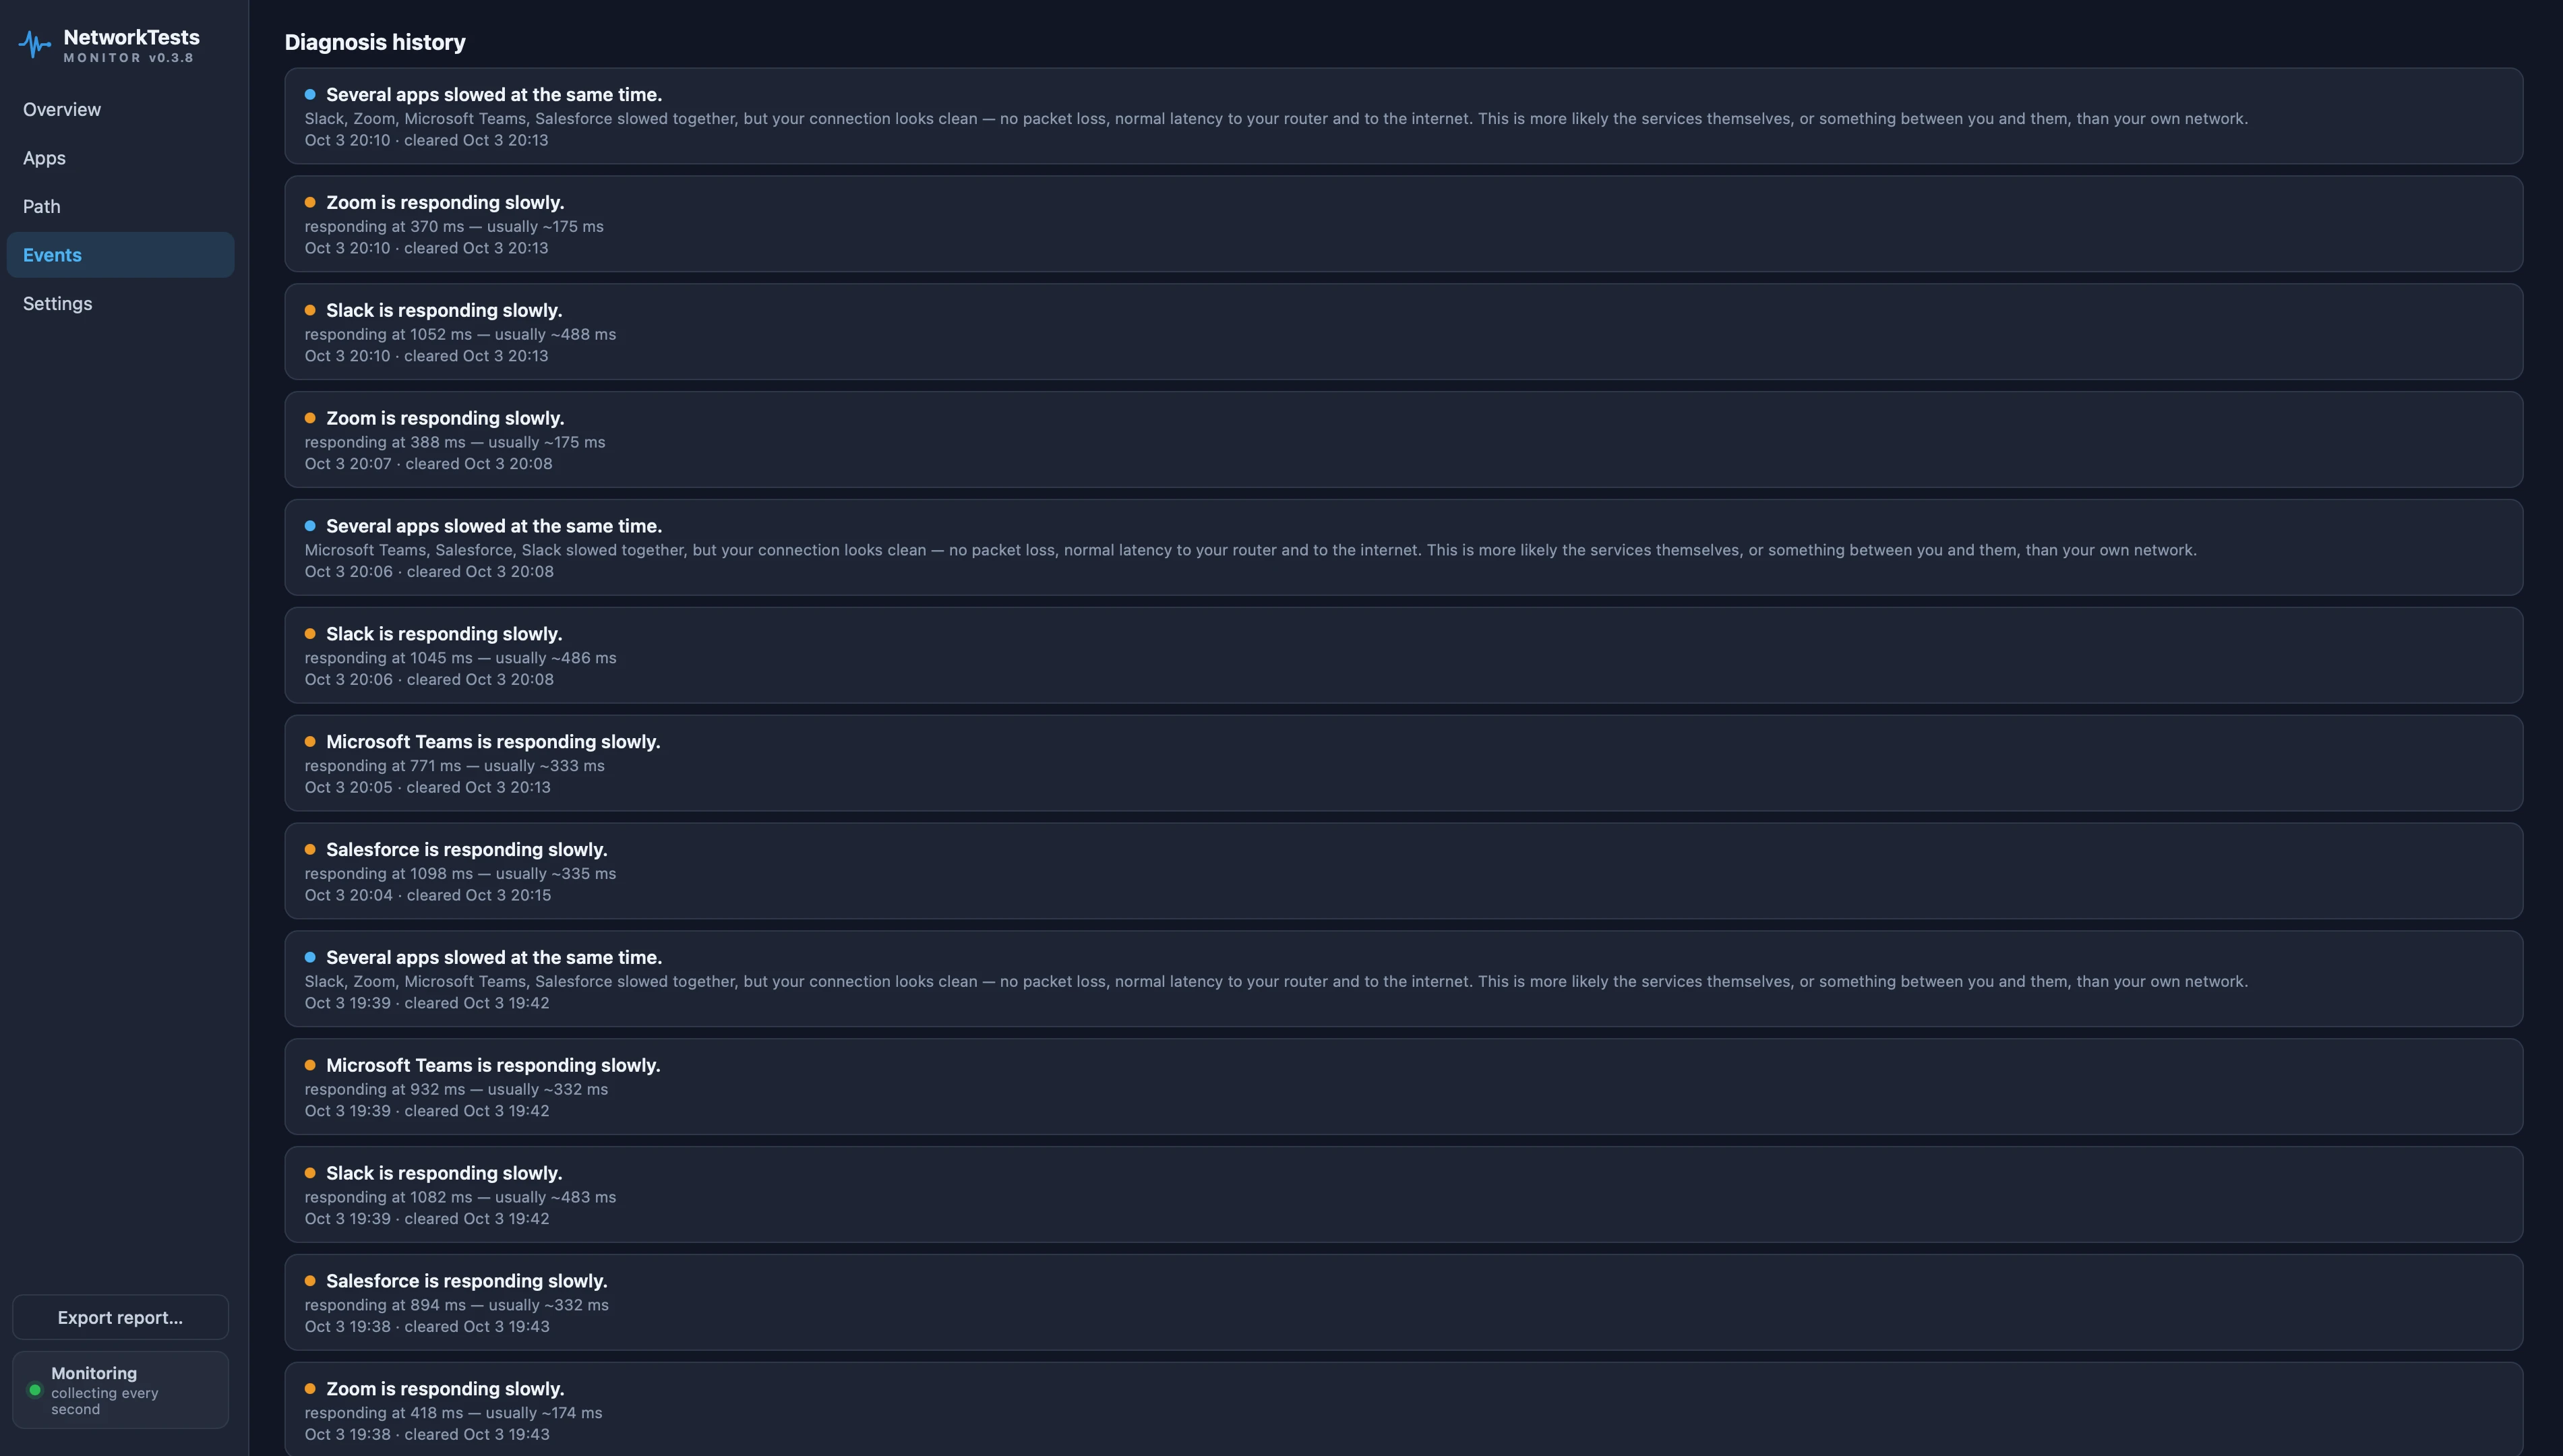
If a single service is responding slowly, that may be a problem with that service rather than your network. You'll see it on the application's card, but Monitor doesn't interrupt you every time one destination has a bad moment.
What it does watch for is several applications degrading at the same time. That tells you they share a cause, but not what the cause is: it could be your connection, but it could just as easily be DNS, your Wi-Fi, or your own computer. So Monitor checks the measurements it is already taking and names the one that explains it:
Your connection is saturated. An upload is filling the link and adding about 50 ms of delay to everything — the round trip to your own router went from 9 ms to 59 ms. Microsoft Teams, Zoom, Slack slowed with it.
And when nothing on your side explains it — no loss, normal latency to your router and the internet — it says exactly that, and doesn't send a notification, rather than blaming a connection that checks out clean. Genuine network faults, like an outage or packet loss, notify you directly.
Hop-by-hop paths, without installing anything else
The Path page gives you continuous MTR-style visibility without the terminal.
Every 60 seconds, Monitor traces routes to Google and Cloudflare — two different networks out of the box — plus up to three destinations of your choice, such as your VPN endpoint, office, or game server. Paths are traced over ICMP (UDP is also available on macOS), and each hop gets a latency and loss history you can inspect over windows ranging from 5 minutes to 7 days.
This is where "the internet feels slow every evening" can become:
Hop 4 consistently adds significant latency between 8 PM and 11 PM, while earlier hops remain stable.
That's the kind of evidence a support ticket can actually use.
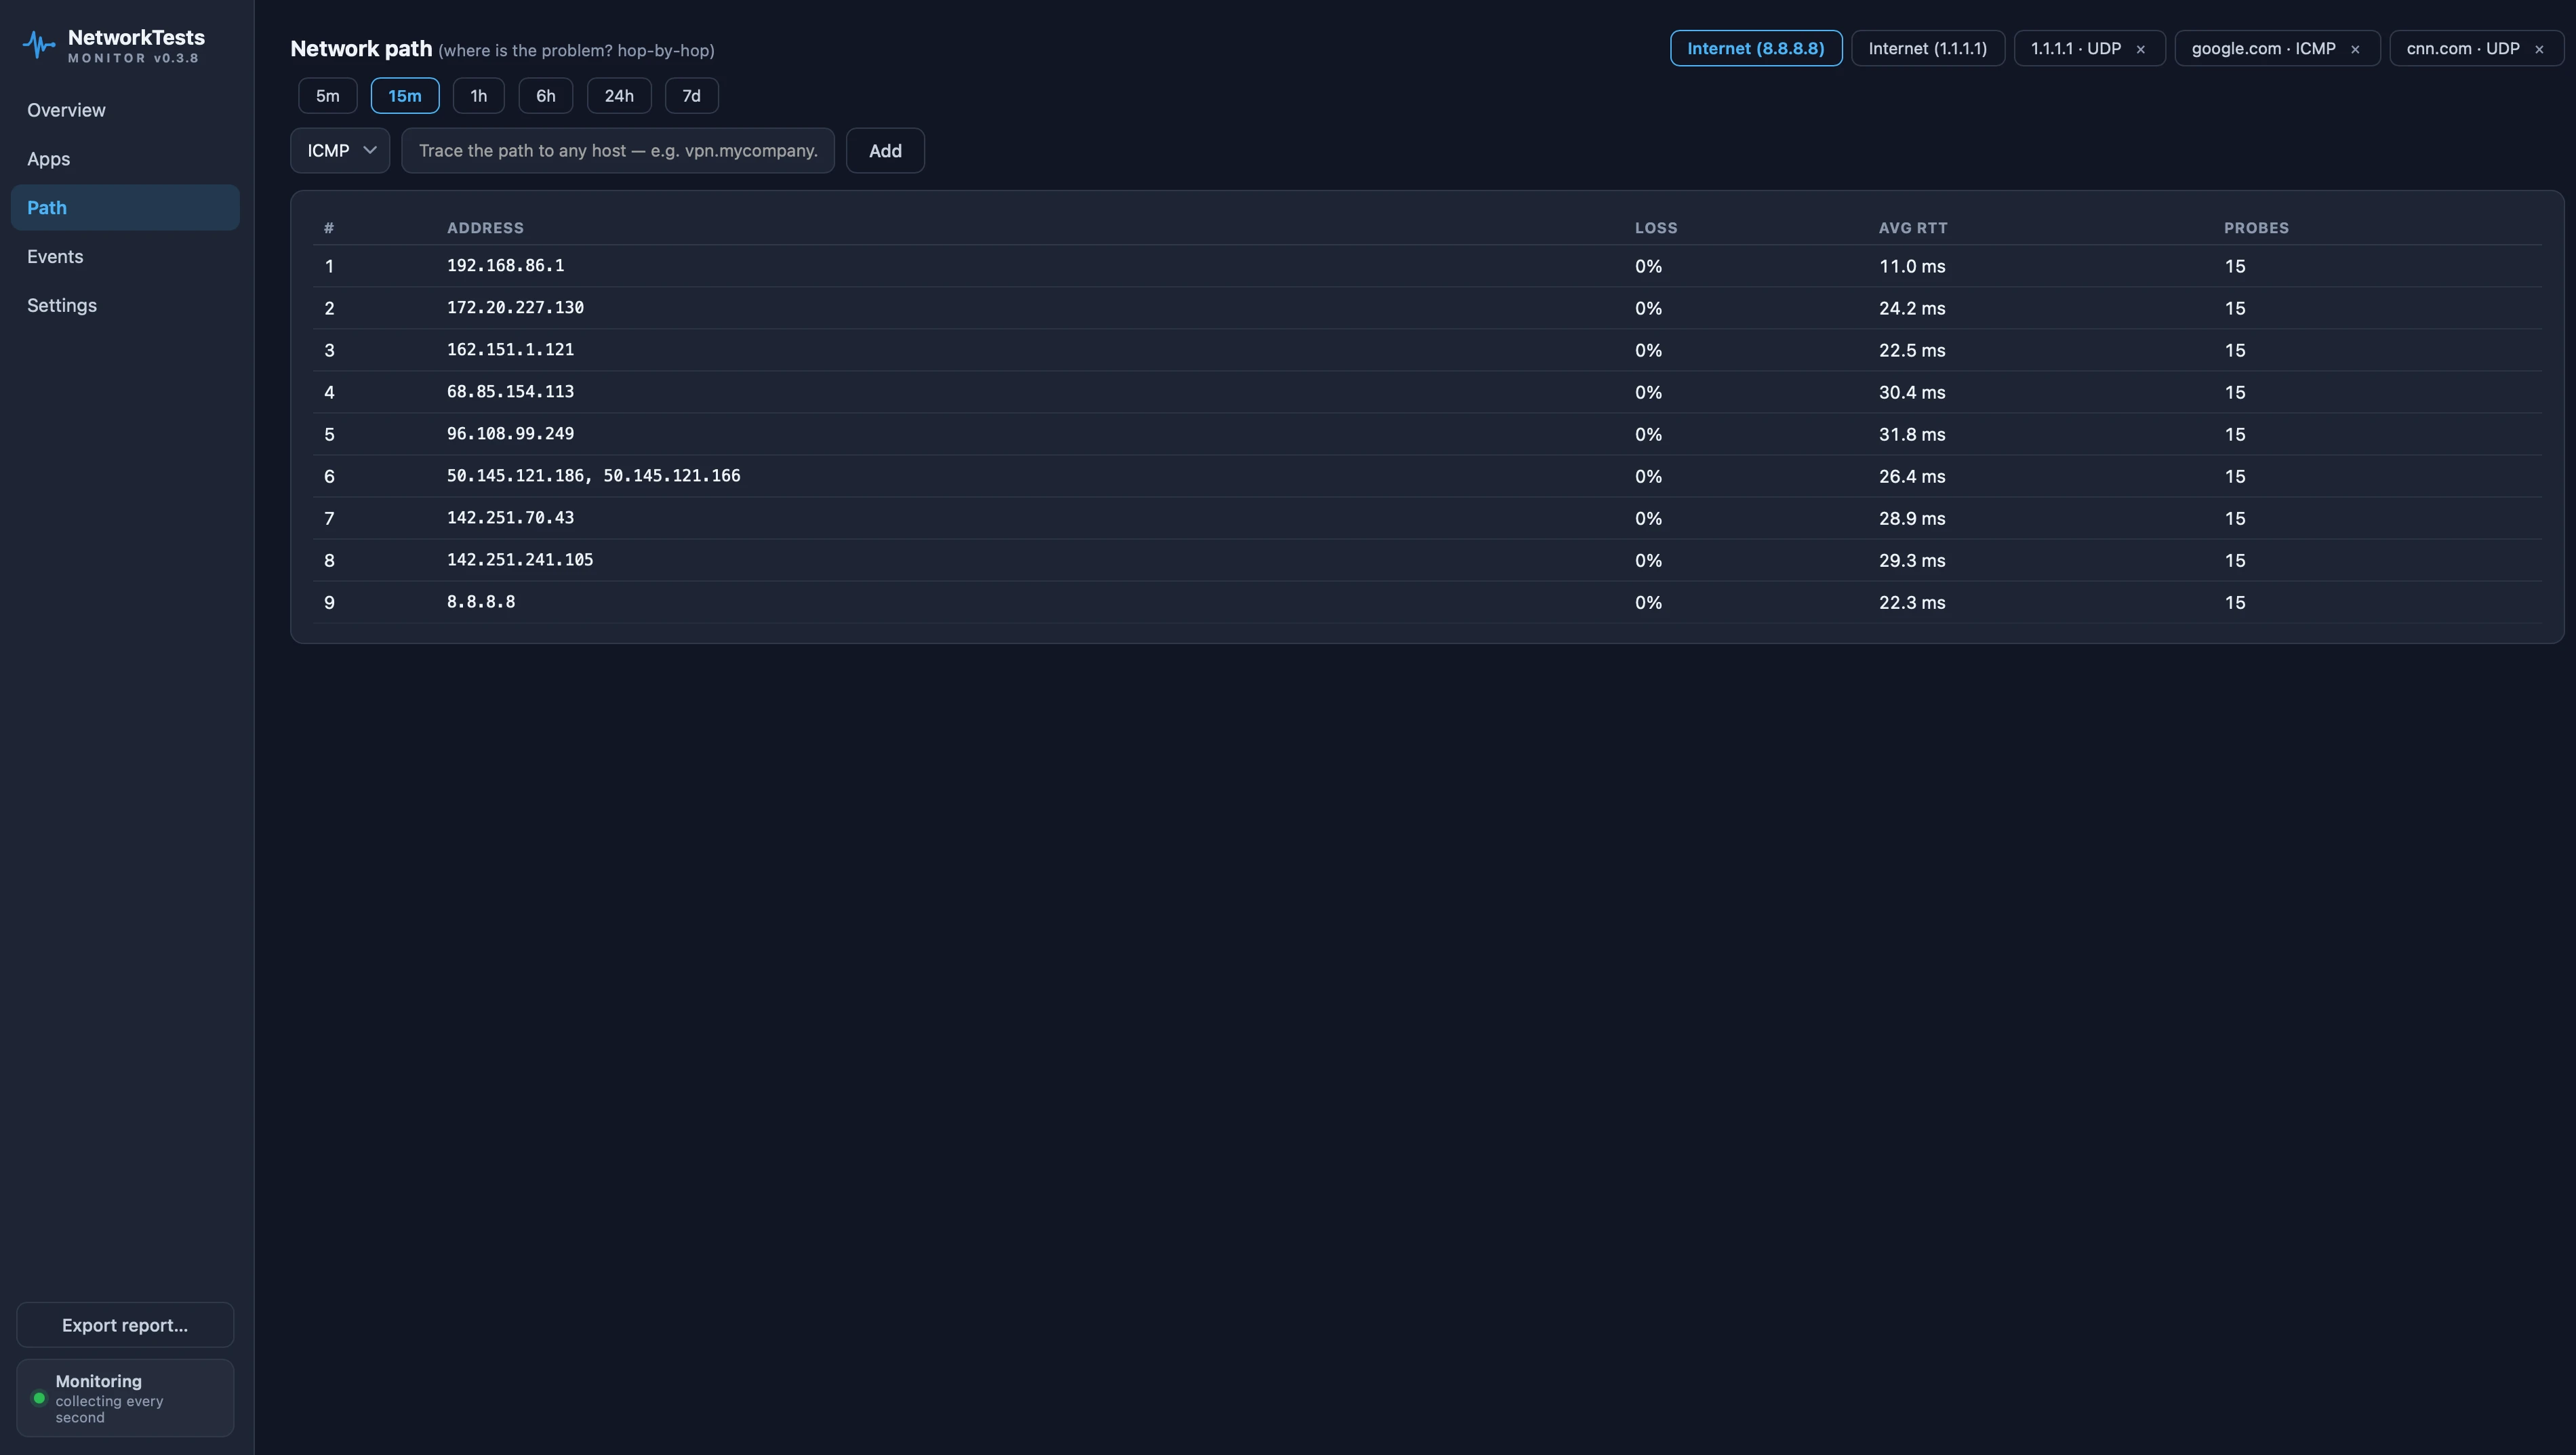
One important caveat: loss reported by a middle hop does not necessarily mean traffic is being lost there. Network devices commonly deprioritize or rate-limit probe responses while forwarding traffic normally. Monitor's path tables make it easier to distinguish that pattern from loss that continues through subsequent hops.
The speed test that measures what speed tests miss: bufferbloat
Monitor includes a proper speed test — download, upload, on demand or automatically twice a day — against the nearest of our four test regions. But the number we most want you to see isn't the megabits. It's this:
Bufferbloat 2.2× — latency increases from 82 → 180 ms under load
Here's what that means, and why it explains so many "fast but terrible" connections.
Your router has buffers — queues where packets wait when the connection is temporarily saturated. Buffers are necessary. But when queues become too deep, something counterintuitive happens: your speed test still shows excellent throughput while latency climbs dramatically. Everything still arrives — eventually. Meanwhile, smaller latency-sensitive packets can get stuck waiting behind the large transfer: your video call's audio, your game's position updates, your keystrokes over SSH.
That's bufferbloat: latency that increases sharply when the connection is busy. It's why calls can break up when someone starts a large upload, why games can lag when a download begins, and why a gigabit connection can sometimes feel terrible under load. A conventional speed test misses it because throughput isn't the problem.
Monitor measures bufferbloat the way it has to be measured: it records your idle latency, then keeps measuring latency while download and upload traffic saturates the connection. It flags severe bufferbloat when loaded latency reaches at least twice the idle latency and increases by more than 200 ms — and when that happens, you get a plain-English verdict pointing toward the most common remedy: SQM (Smart Queue Management) on a capable router. We wrote the full guide separately: How to Fix Bufferbloat.
Because Monitor runs these tests automatically, you also get to see what bufferbloat looks like during your actual busy hours, rather than only when you remember to run a test.
The evidence report: end the "everything looks fine from our side" era
All of this history exists for a purpose: getting from "it feels slow" to evidence that someone can actually investigate.
Hit Export report, choose a window — from the last 5 minutes to the last 7 days — and Monitor produces a PDF evidence report containing:
- latency and packet-loss charts comparing router and internet measurements
- Wi-Fi signal history
- CPU, memory and network-usage charts
- application response times with phase breakdowns
- hop-by-hop tables for monitored paths
- the complete event timeline
- a methodology section explaining how the measurements were collected
Attach it to your ISP support ticket. Instead of "my internet feels slow at night," you can send:
"Packet loss increased beyond the router between 9:02 and 9:41 PM on three consecutive nights, while the router itself continued responding normally. Report attached."
That changes the conversation. For the complete troubleshooting playbook, see How to Get Your ISP to Actually Fix Packet Loss.
Seeing intermittent problems you can't explain?
Install Monitor and start collecting evidence before the next incident.
Private by architecture, not by promise
Monitoring software shouldn't need to turn your connection history into someone else's data.
NetworkTests Monitor is designed so that your monitoring history stays on your computer. There is no account required and no sign-up flow; your measurements are stored locally rather than in a central monitoring dashboard. You decide when to export a report and who gets to see it.
That local-first design also helps keep the application lightweight. A monitor that consumed significant CPU or bandwidth would interfere with the very connection it's supposed to measure — so Monitor is engineered to use a small amount of CPU, generate only lightweight probe traffic during normal monitoring, and hibernate its interface when you're not looking at it.
Free for personal use — get it now
NetworkTests Monitor is free for individuals. Not free-during-beta. Not free-until-we-change-our-minds. Monitoring your own connection, keeping your own history and exporting your own evidence reports is free, with no account required.
For businesses, a paid edition is coming with fleet monitoring and centralized reporting for IT teams that need visibility across employee and remote-worker connections. Contact us if that's you.
NetworkTests Monitor runs on:
- macOS 12+ — Apple Silicon and Intel, signed and notarized
- Windows 10/11 — signed installer
- Linux — x86_64 and arm64, one-command install
Install it once and monitoring starts immediately, running quietly from the menu bar or system tray.
Download NetworkTests Monitor
The next time your connection acts up, don't wait for it to happen while you're staring at a speed-test page. Monitor will already have the history, the evidence, and a clearer picture of where the problem started.
Something is wrong right now and you can't install anything? The browser-based network test still has you covered.
More guides
Your Bufferbloat Test Is Lying to You
A bufferbloat test run at a quiet moment tells you almost nothing — bloat is a busy-hours problem. How latency-under-load is measured, how to read the numbers, and how NetworkTests Monitor tests it automatically, for free.
What Wi-Fi Actually Costs You
Wi-Fi rarely costs you bandwidth. It costs you consistency — and that is what breaks calls and games. How to measure the real difference on your own connection.
Why Your VPN Slows Everything Down
Encryption is rarely the reason a VPN is slow on modern hardware. Distance, a busy exit server and MTU are — and MTU is the one that makes some sites hang forever while everything else works.
What Your IP Address Actually Reveals
What someone can and cannot learn from your IP address, why geolocation is so often wrong, and how to tell whether you are behind carrier-grade NAT.